Smart Table
Background
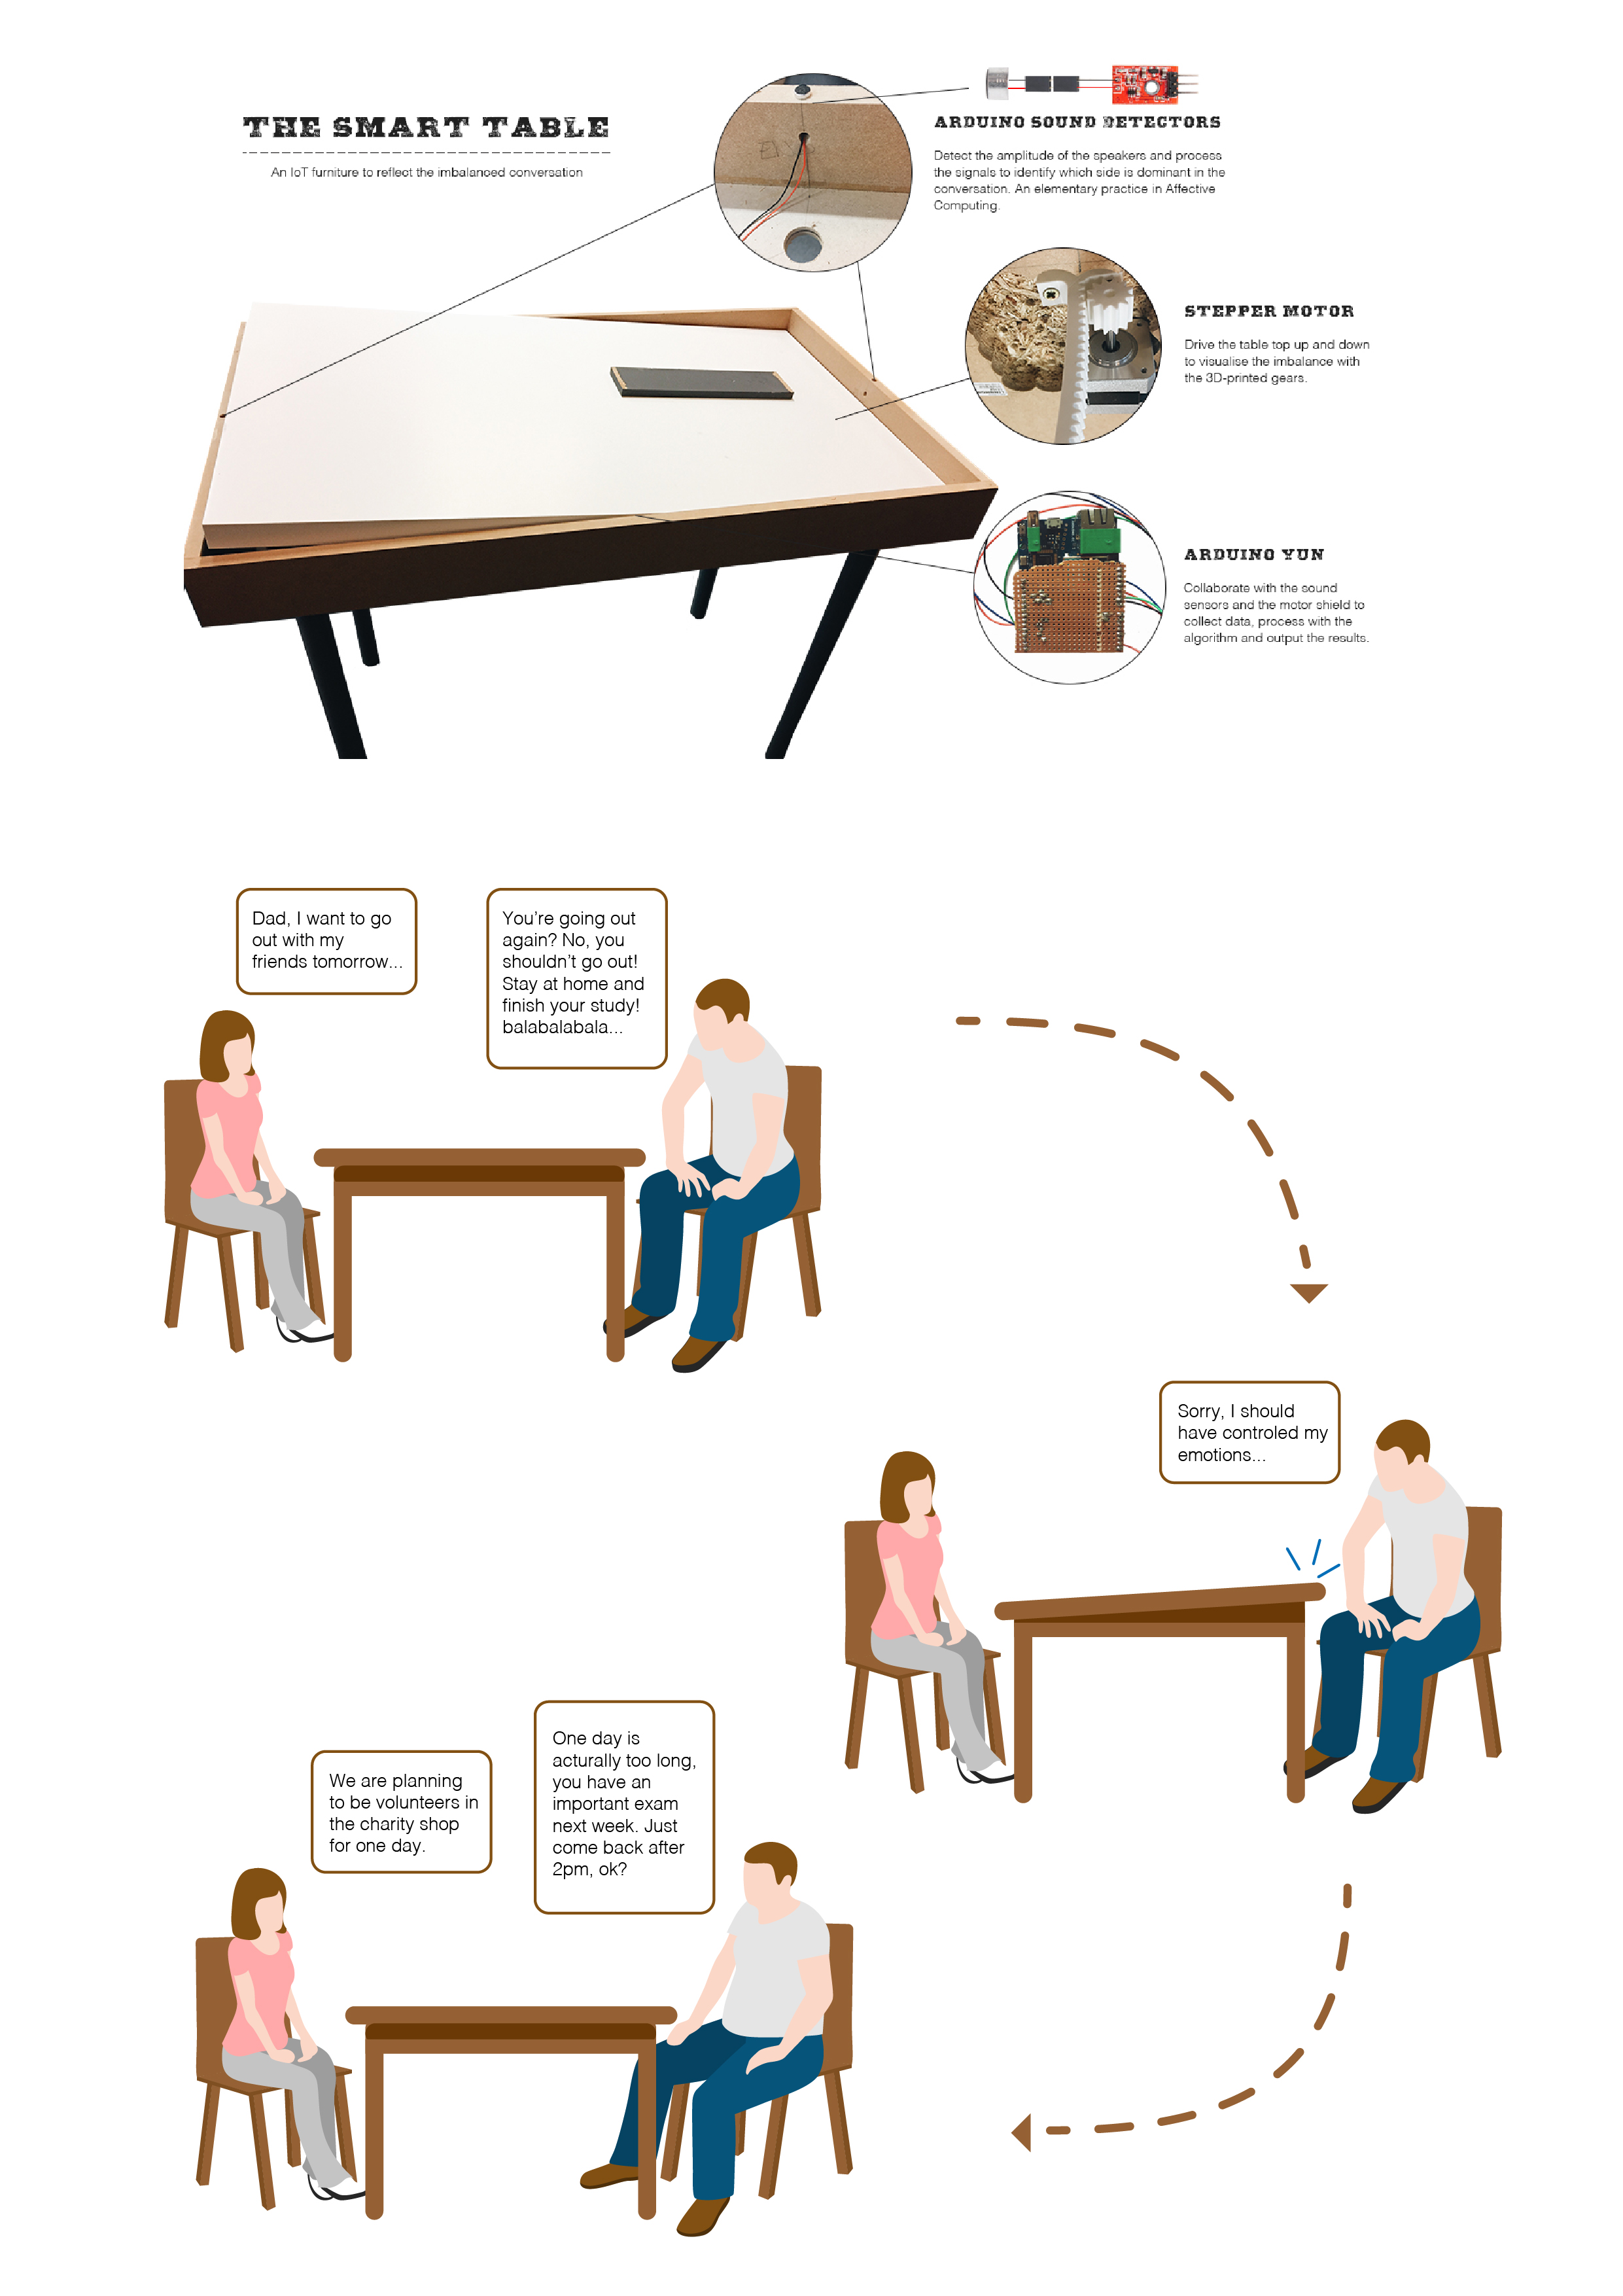
Unhealthy communication patterns influences the relationships between two parties, “It is not what you say, it is how you say it”. Emotion regulation in communication requires people to empathise with the other side and to keep reflecting on his/her own behaviours. The Smart Table physically reflects the dominance of a person in a conversation, aiming at helping families and other disputing or contentious parties, to ease tensions and find more harmonious ways to communicate.
Research Methods
Interview, Empathise, Brainstorming, literature research, prototyping and Wizard-of-Oz test, sensor data visualisation and analysis (D3.js)
01
Interview
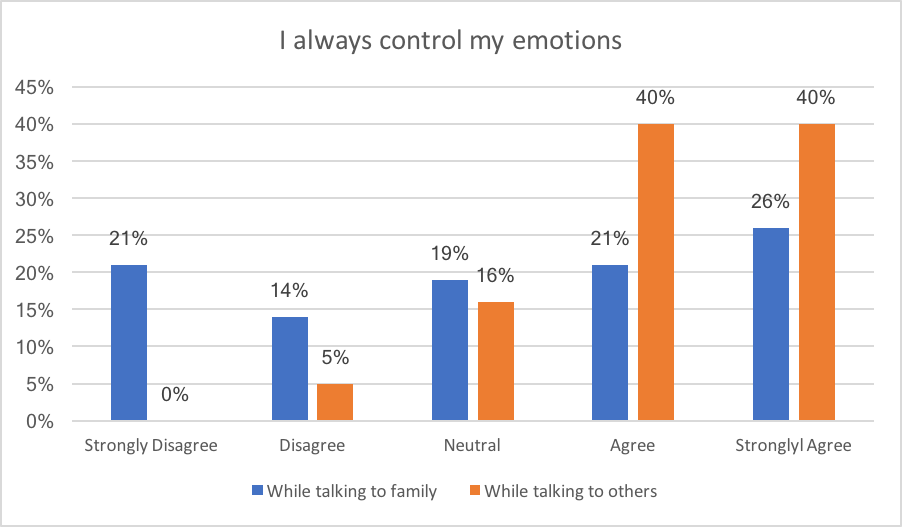
An interview about emotion regulation was carried out. The result shows that interviewees do not care so much about their emotions while talking to their family although most of them do while talking to other people. In a close relation, people tend to be more relaxed however the negative effects caused by the recklessness cannot be ignored.
02
Empathise
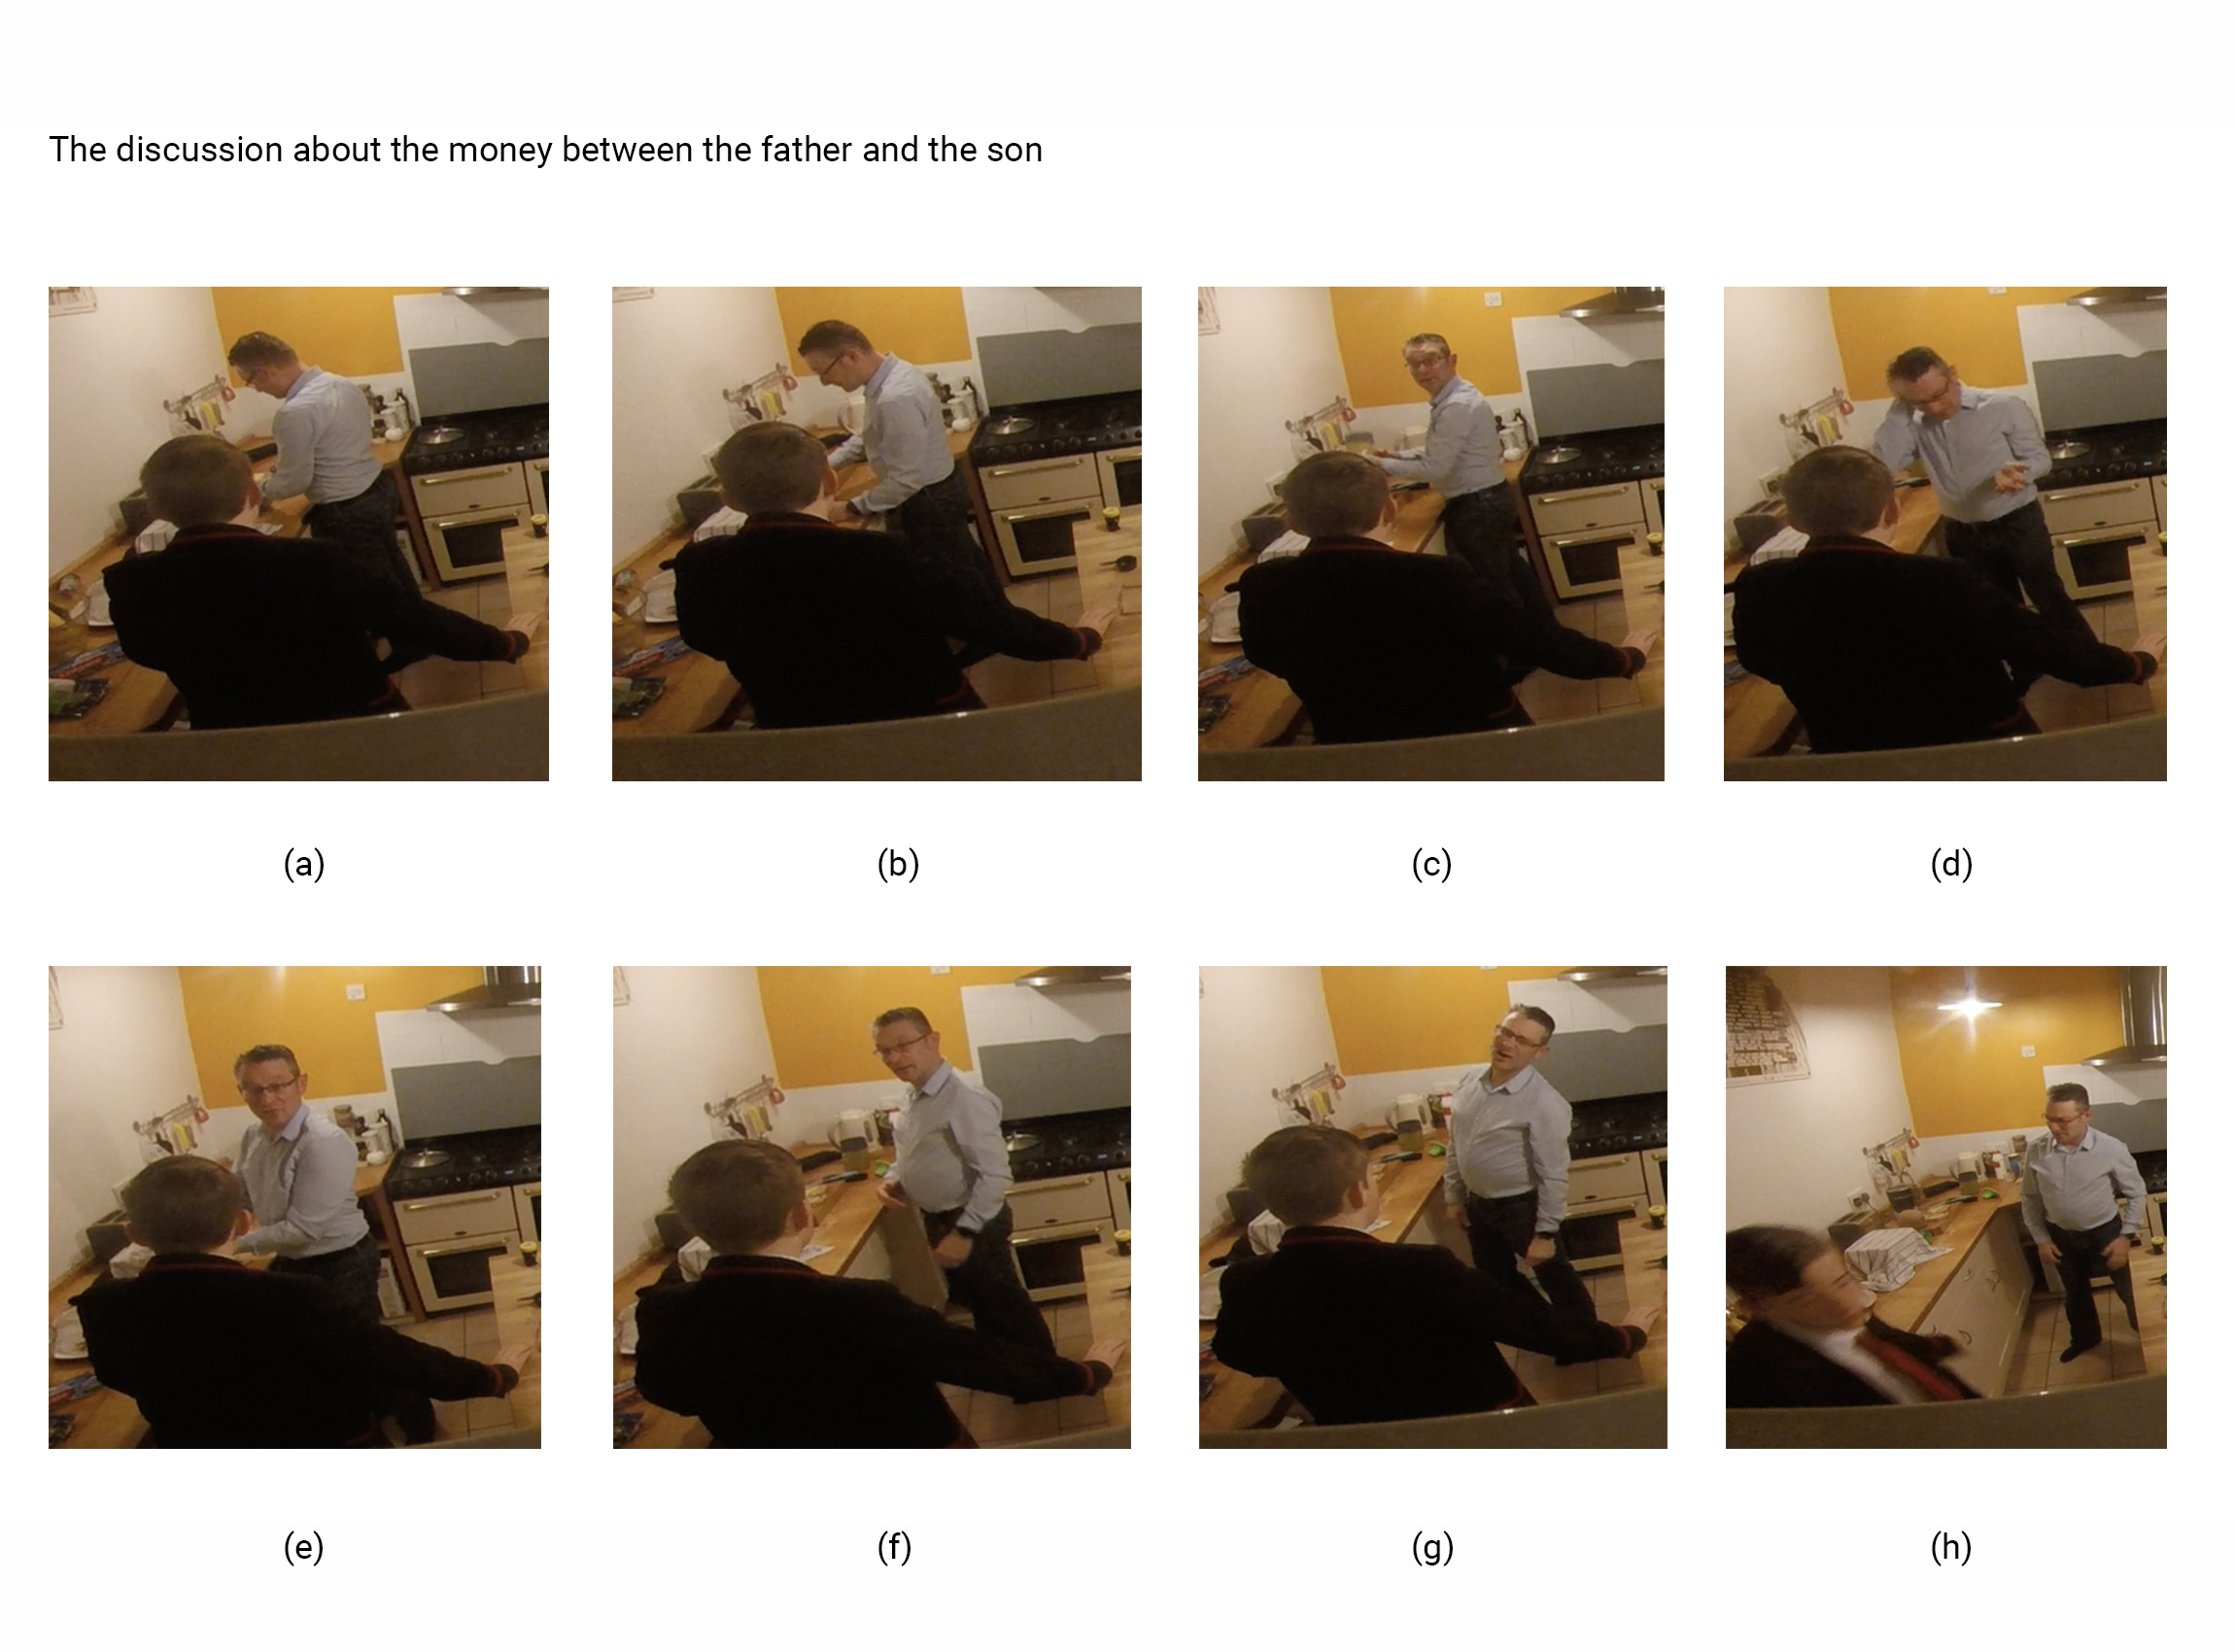
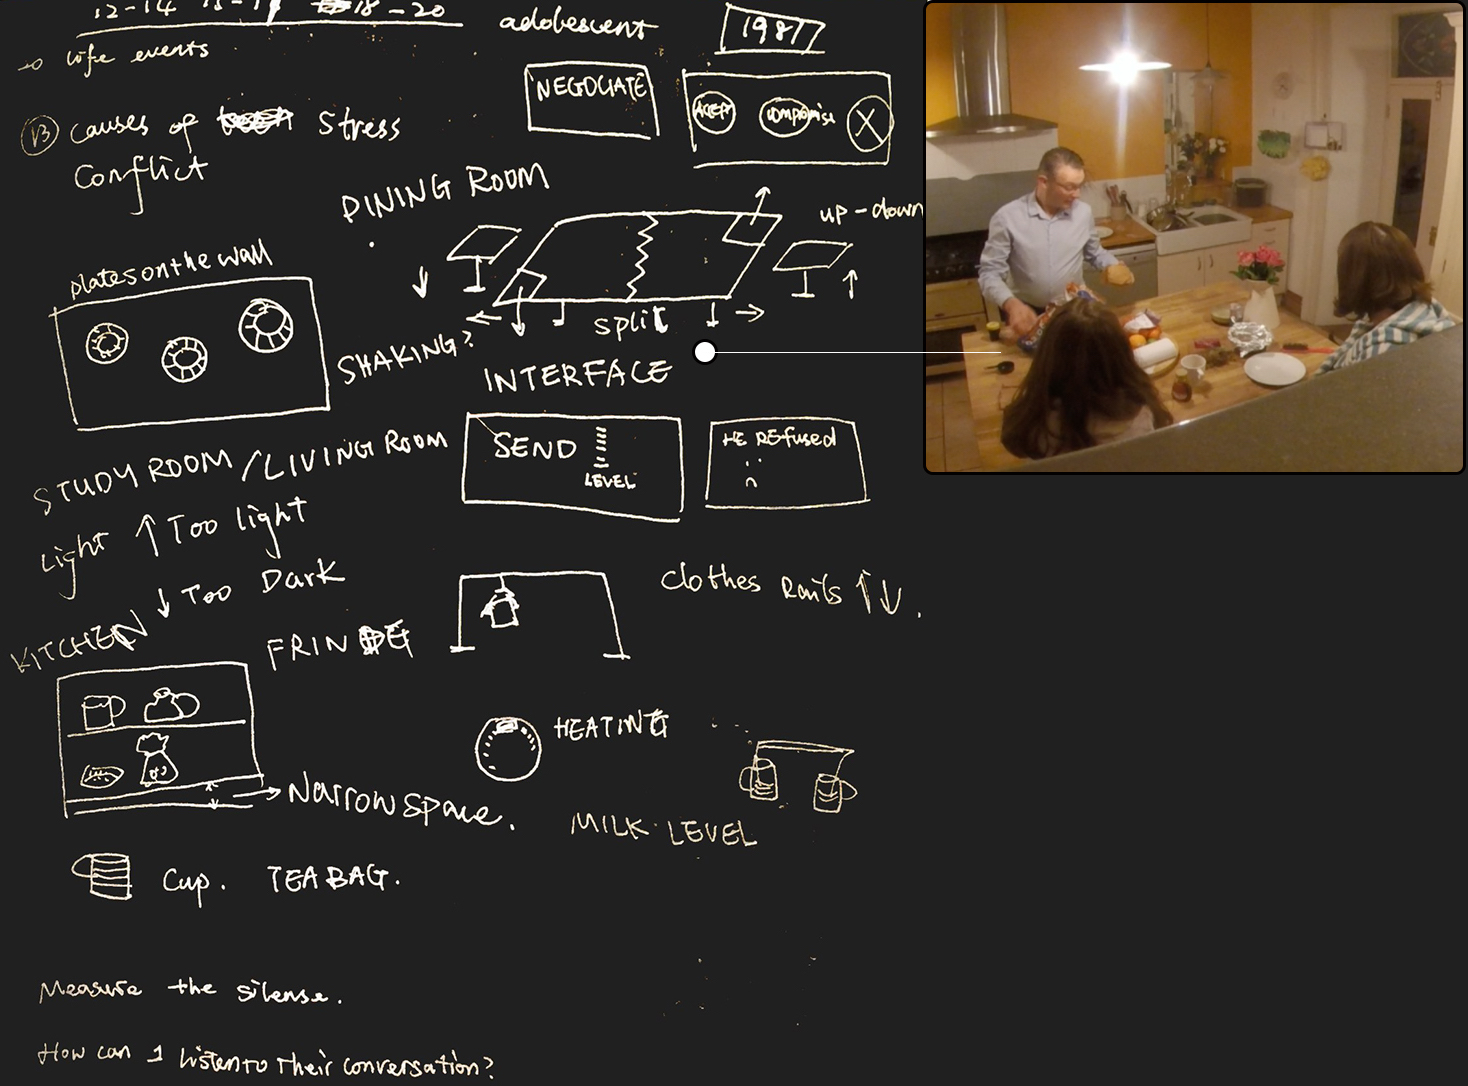
Empathise by observing family communication pattern. The subjects are a family with four members, parents, a son and a daughter that was observed with a camera set up in the kitchen for two days. From the observations, the researcher summarised several typical behaviours that potentially lead to family conflicts.
03
Brainstorming
There are several objects to be considered as the metaphor. Among all the ideas, the dining table was considered as the final decision since it is essential to most of the households: when people start a discussion or just casually chat, they often sit at the table with a cup of drink. Moreover, no matter it is breakfast time or dinner time, the dining room is an area where every family member spends the mealtime together.
04
Affective Computing
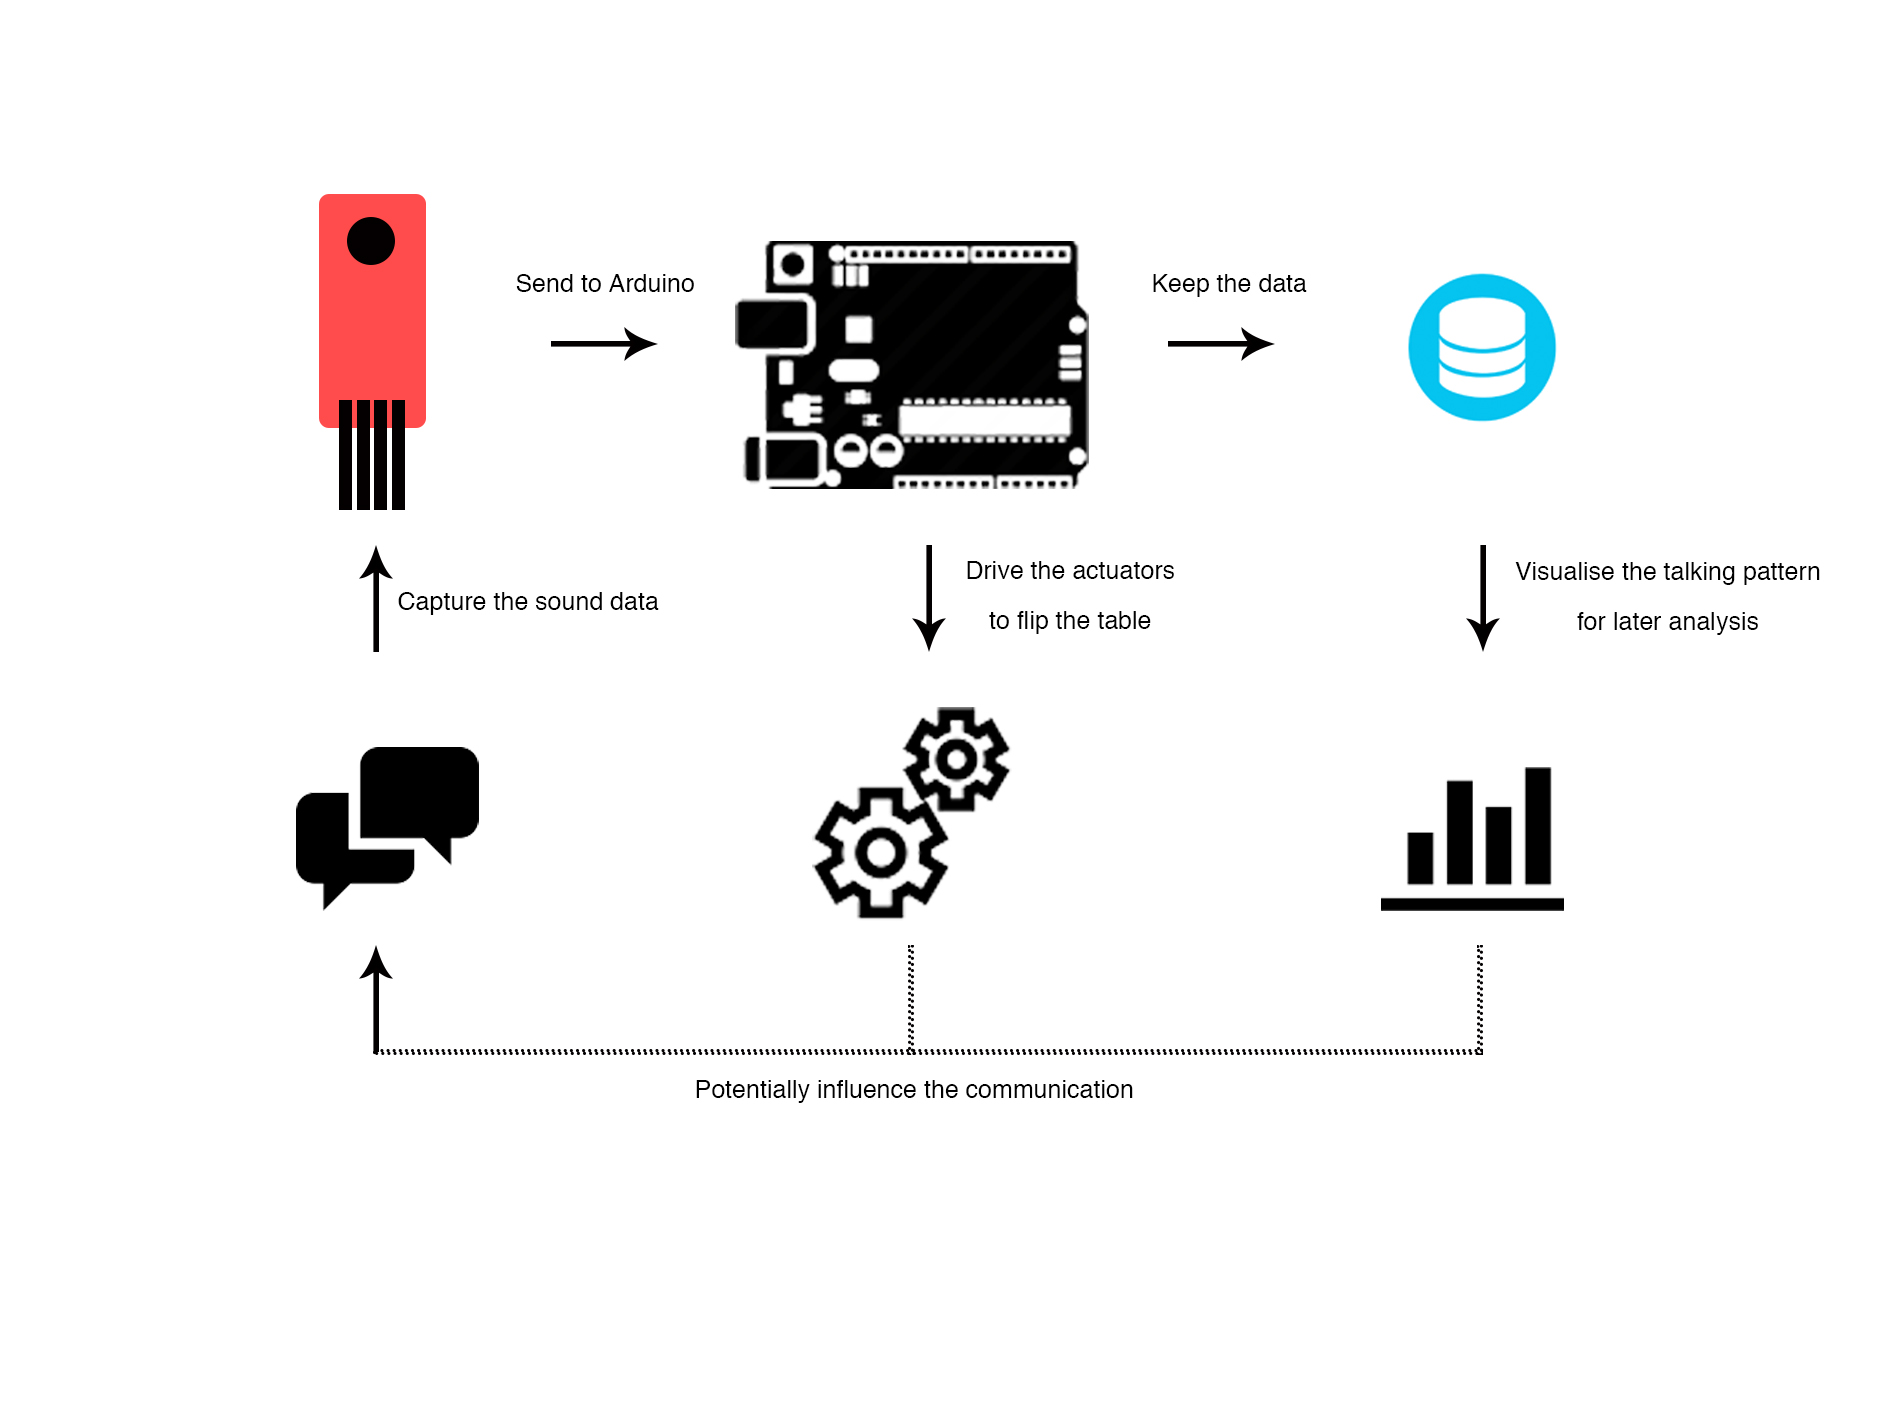
Affective computing makes the project possible to read humans' emotions and therefore identify the dominance in a conversation. Driven by Arduino and its components, the table top flips slightly when it detects the imbalance.
05
Sensor Data Visualisation
Sensor data (Volume) collection and visualisation. During the conversations, most of the recorded data between course mates were balanced which might be because of the topics selected to test since most of them talked about the study plan, travelling, popular TV shows. Except Group Course Mates A had a short conversation, the rest of the groups’ talking durations were about 700-850 seconds (10-15 minutes). The noise (values over 40) is relatively less than the previous test without the table which also suggests the dimension of the table is reasonable because the sound inputs mostly fluctuate within a standard range.
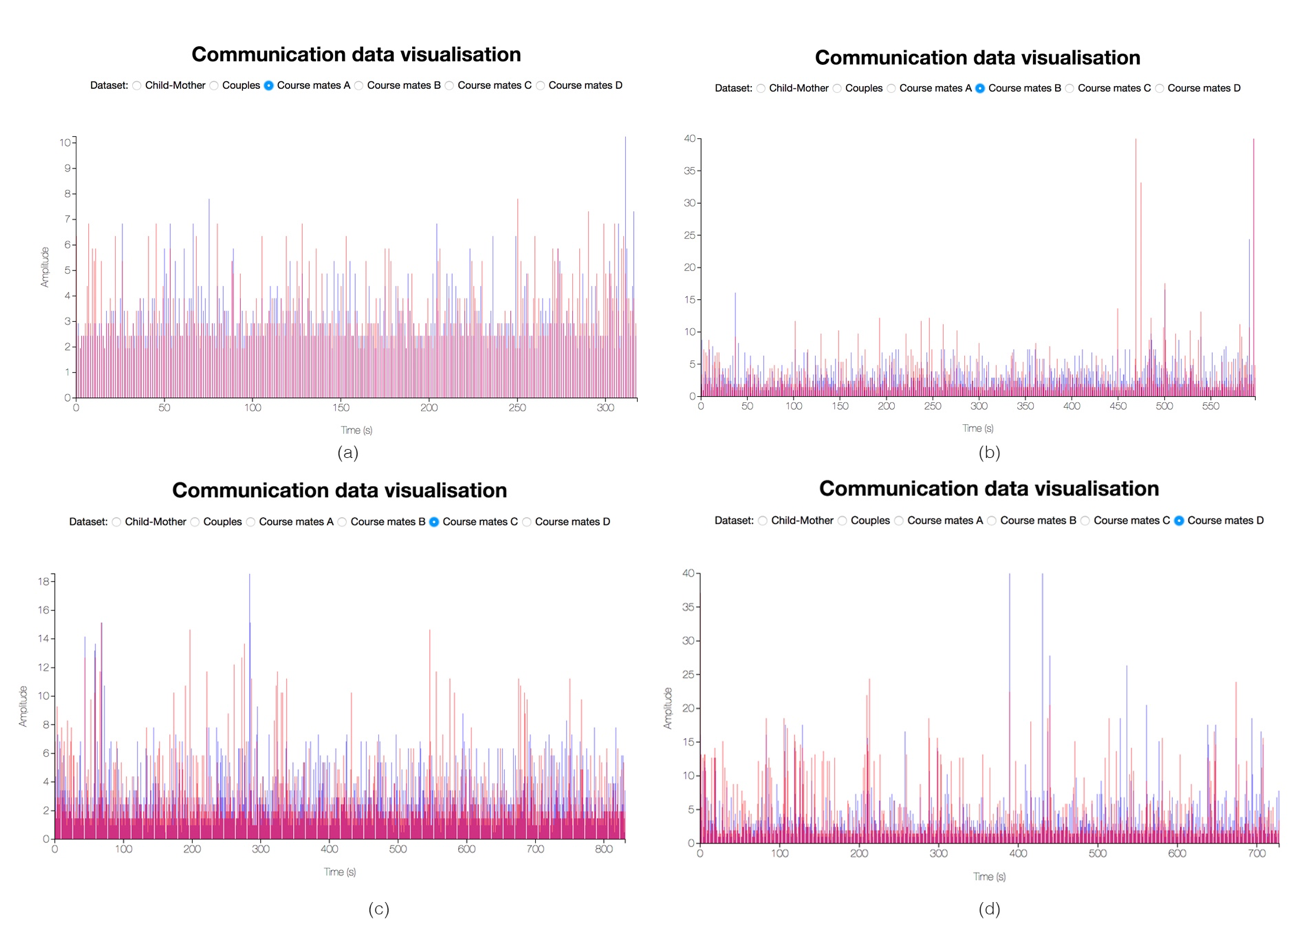
Although the sensor data is not accurate enough to analyse the talking volumes and pitches of both sides, we can still observe the overall talking patterns from the data visualisations. Group Course Mates A (a) and B (b) had a relatively balanced conversation, yet in Group B, the talking duration was relatively longer. These two groups “Strongly Agree” that the table can make them reflect on their behaviours and emotions. The data of Course Mates D (d) represented those groups that started with an “imbalanced conversation”, but after the table reacted to their conversation, the “dominant sides” adjusted the talking length. We can see from the figure, during the first 180 seconds “the Red side” talked predominantly, then the speaker role was taken in turn within a generally fixed duration. This was the most common reactions sequences of participants:
1) starting the conversation
2) noticing the movements and becoming surprised
3) understanding the concept
4) continuing talking, some would try to keep the table balanced whereas some did not react to the movements after a while.
There were two pairs that reacted in the way illustrated by Group C (c) who did not give so many concerns as the other groups, but they still considered it as a good metaphor and a good reminder for self-control. One of the members from Group C commented “I think it's useful to people if they want to change, but they will discard it if they choose not to obey themselves”. A comparable feedback was given by another group whose data was not recorded “It made me think of how to manage my way of talking, but I don't know if I would care in the long run!”. Again, the comments prove that the goal of the smart furniture like the Smart Wardrobe and the Smart Table should be providing a tool for facilitating self-assessment of inappropriate behaviours, instead of forcing them to obey the products’ principles. The concept was successfully conveyed. 75% of participants agreed or strongly agreed that the table was a good metaphor to visualise the imbalanced conversation. Almost 70% agreed that the interruption of the table gave them an appropriate break to reflect their behaviours and emotions. Furthermore, more than half of them considered IoT as a good solution to assist self-control yet some pointed out that whether the products could influence the user also depended on the user’s choice. While many people regarded this Smart Table as a useful product, only a quarter of the feedback were willing to have one at home regardless the price, which might be related to the data security concerns.
Final Product
Reflection
Using family communication issue as a case study to design an IoT product is the goal of this project. It allows me to propose an IoT product design methodology to an issue that closely related to everyone. The research on affective computing explored the convergence of Artificial Intelligence and IoT.